Shadow recently released their 2nd and 3rd tier PC Plans in late 2020 and we signed up for the Ultra plan once it was available. We also made a benchmark video previously for the Boost level so, naturally, we had to make a benchmark video for the Ultra tier.
For the Ultra plan benchmark, we used most of the same software to get comparable numbers so we can compare them to the Boost plan to see how better the Ultra plan is over the Boost plan. PCMark10 will get a general state of the whole machine, while the graphics software 3DMark will get the benchmark stats on the GPU. Let’s get into it.
Shadow Ultra PC Stats
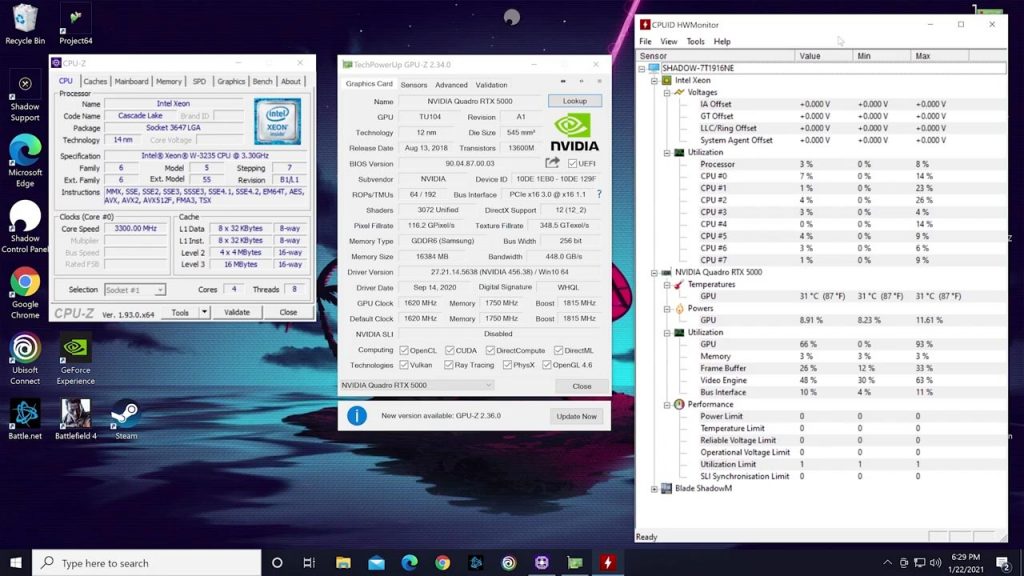
To start off, we’ll get the hardware stats for the Ultra machine I am using. We’ll be using CPU-Z, GPU-Z, and HWMonitor to get all the stats while the PC is idle like we did last time on the Boost benchmark.
CPU: Intel Xeon W-3235 @ 3.30GHz
The Intel Xeon W-3235 CPU is a 12 core CPU with 24 threads. It launched in the second quarter of 2019 and has a codename of “Cascade Lake” with a clock speed of 3300 MHz (3.30GHz).
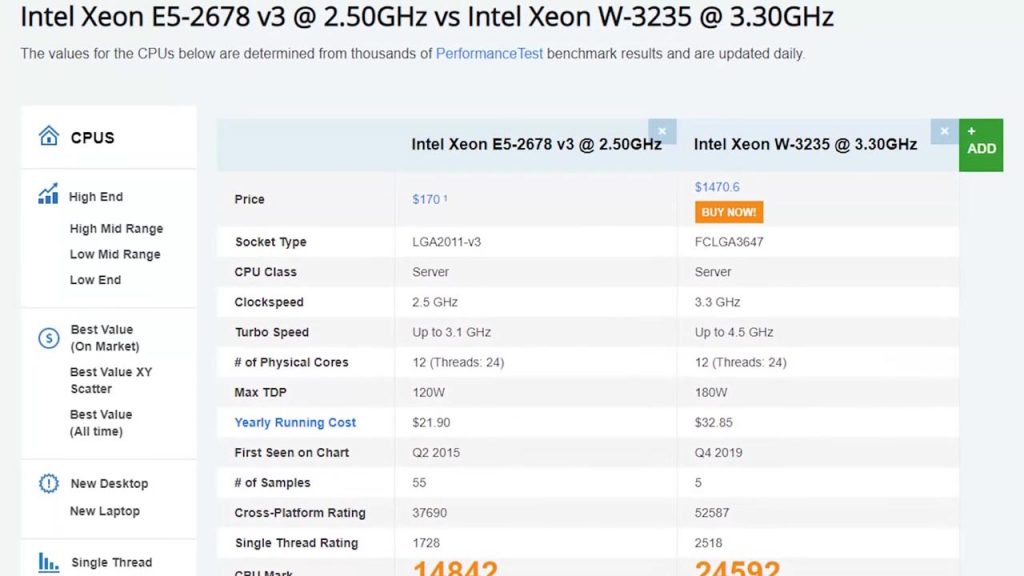
I compared this processor with the Boost processor on CPUBenchmark.net and it got a considerably better score as expected. The only real drawbacks are that it costs a lot more and needs more power.
GPU: NVIDIA Quadro RTX 5000
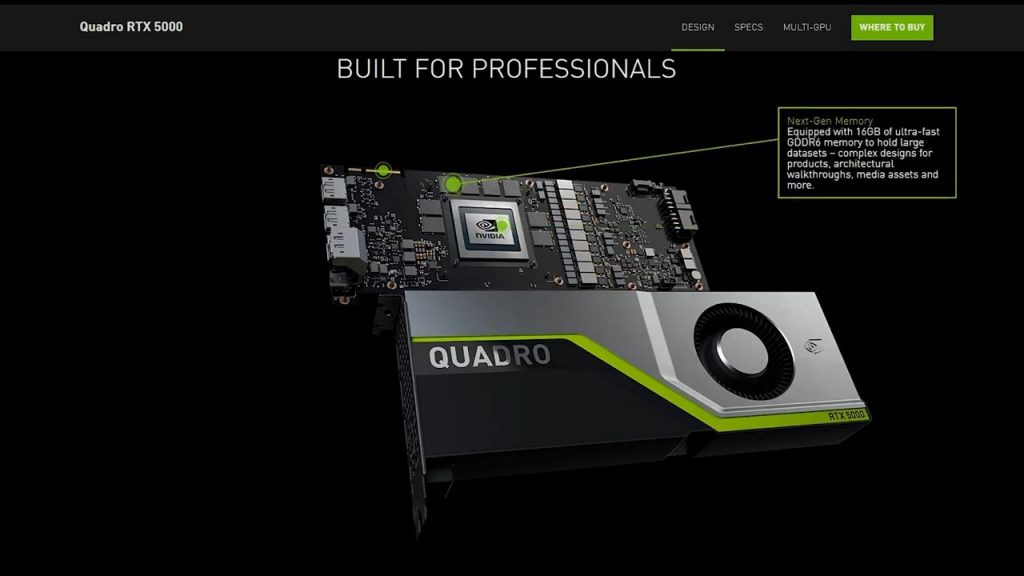
My Ultra PC is using the NVIDIA Quadro RTX 5000. With the Quadro RTX 5000, you can now really game in 4K bliss unlike the Boost PC. It’s made with the Turing Architecture which supports ray-tracing. It is also equipped with 16 GB of video memory and supports dual linked GPUs.
I knew this was guaranteed to blow away the Quadro P5000 of the Boost PC so I compared this to the RTX 2080 for a better comparison.
As you can see, the comparisons are very similar. So it is safe to say that the Quadro RTX 5000 is basically a workstation equivalent to an RTX 2080.
PCMark10 Ultra Benchmark
Let’s move on to the overall PC score benchmark with PCMark10. This test took about 35 minutes and benchmarked every type of application and included graphics processing. The graphics processing test is not great but it gets added to the overall score of the full benchmark.
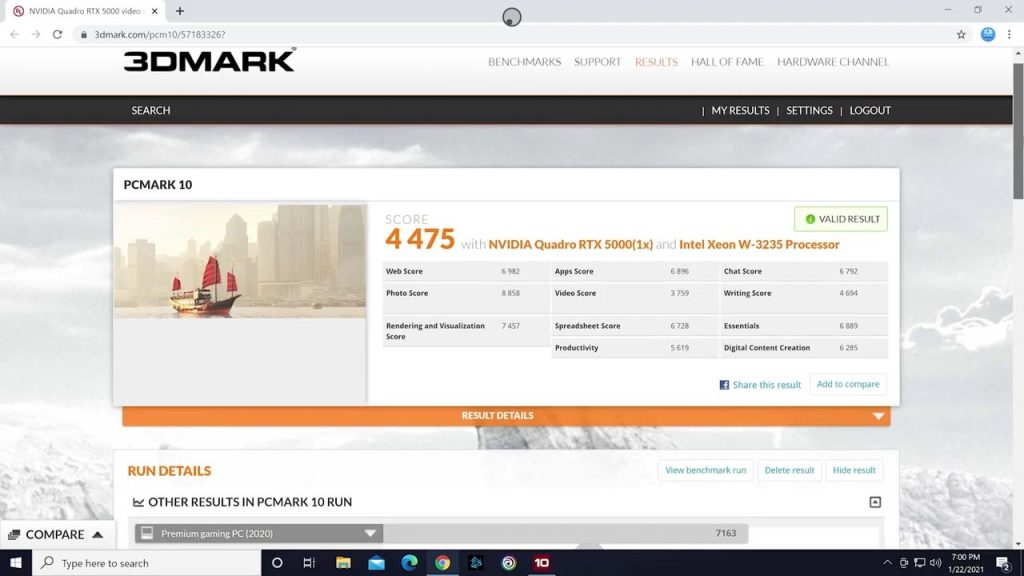
The score of the benchmark hit 4475. PCMark10 breaks down the benchmark in several categories and gets the average of all the benchmark tests. Note the details in the PC and the comparisons vs. other PCs with different builds.
I also pulled up the archives to find my previous score of the Boost PC which is 3894. So you can see the increase of the score from the Boost PC to the Ultra.
3DMark Ultra Benchmark
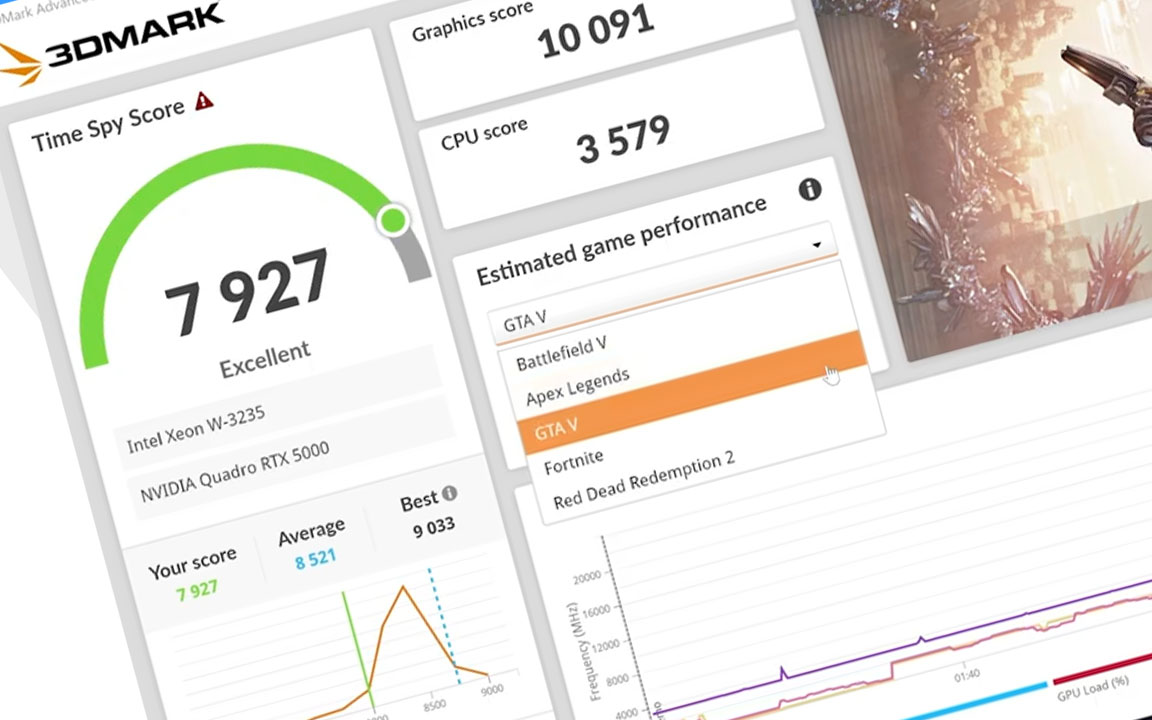
Now, for the good stuff. I am going to run the Time Spy benchmark test once again for the Ultra benchmark. This consists of three tests – Two separate graphical specific tests and a particle CPU test. These tests will be running in 4K as well. I’ll run all the tests in full and I’ll blow up the stats figures so you can see it better since they were a bit small on screen.
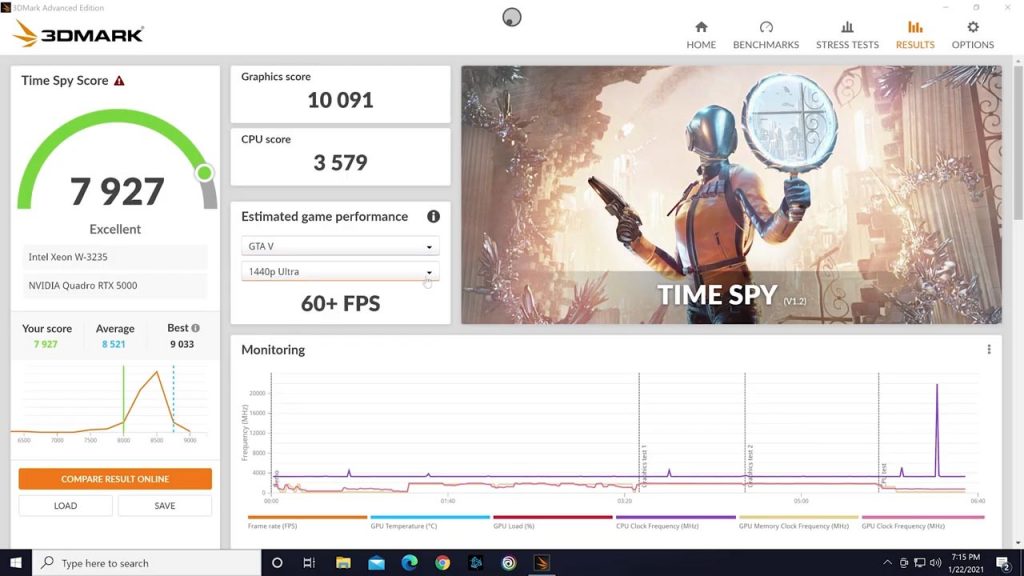
The final results score came to a nice 7927. I didn’t expect anything less though on the Ultra plan. On the screen, they have an estimated game performance box where you can see the estimated FPS with selected games.
Once again, the Ultra PC out performs the Boost PC by over 2000 points. The Quadro RTX 5000 is really quite the upgrade.
Port Royal Ray Tracing Benchmark
We have something special for you this time. 3DMark has a Ray Tracing test called Port Royal so we gave it a spin to see how well it would perform. Take a look at the ray tracing performance of the Ultra plan.
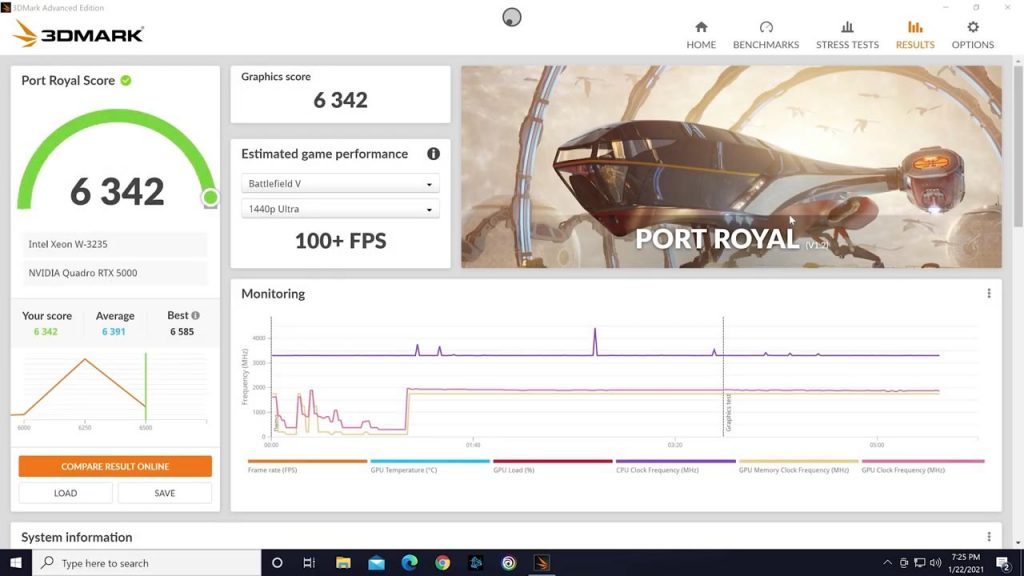
As you can see, the RTX 5000 did really well on the Ray Tracing test. Feel free to run your favorite Ray Tracing games.
Overview
The Ultra plan really is a great upgrade from the Boost plan PC. Running most games at 4K with 50 to 60 fps should be no problem depending on game and settings of course. We’ll be playing and benchmarking individual games in the near future, so look out for those.
Let us know what you think in t he comments below and be sure to subscribe to get the latest news and gameplay on cloud gaming on at the only place where you can do battle in gaming heaven – Cloud Gaming Battle.

